
Insomnia statistics: the key numbers
These figures cover clinically defined insomnia and insomnia symptoms in adults worldwide, with US-specific data highlighted. Data years range from 2002 to 2026. All figures are from published systematic reviews, meta-analyses, national surveys, and official health statistics.
Insomnia is genuinely one of the most common health conditions worldwide. Depending on how it is measured, somewhere between 1 in 8 and 1 in 6 adults meet diagnostic criteria — and around 1 in 3 experience at least some insomnia symptoms at any given time.
- ~852 million adults worldwide — estimated global count living with clinically relevant insomnia, equivalent to 16.2% of the adult population (Sleep Medicine Reviews, 2025)
- 12.4% — pooled global prevalence using the gold-standard method: a clinician-administered DSM diagnostic interview (Journal of Sleep Research, 2025)
- ~37 million US adults — estimated to have insomnia disorder (SLEEP, 2024)
- 38.2% — insomnia prevalence in pregnant women, roughly 2–3× the general adult rate (PMC / Frontiers in Psychiatry, 2024)
- OR 2.60 — the odds that someone with insomnia will go on to develop depression, versus someone without insomnia (BMC Psychiatry, 2016)
- 45–54 lost workdays per year — average workplace productivity loss linked to chronic insomnia, translating to GDP losses of $1.8–$207.5 billion annually across countries (RAND, 2023)
These numbers describe populations, not individuals — your own sleep pattern may look nothing like the average. The full explanation of what insomnia is, why it develops, and what actually helps is in the full insomnia guide.
Figures come from the published research and official sources listed below. This page is for information, not medical advice.
How common is insomnia globally?
An estimated 852 million adults worldwide — about 16.2% of the global adult population — experience clinically relevant insomnia, based on a 2025 systematic review that combined prevalence data with UN population statistics (Sleep Medicine Reviews, 2025). When clinician-administered diagnostic interviews are used — the stricter, gold-standard method — the pooled figure is 12.4% (Journal of Sleep Research, 2025).
- 16.2% (≈852 million adults): global adult prevalence by population modelling — covers adults ≥20 years worldwide; 2025 systematic review combining 18 studies (n=262,582) (Sleep Medicine Reviews, 2025)
- 7.9%: global prevalence of severe insomnia specifically, from the same modelling study (Sleep Medicine Reviews, 2025)
- 12.4% (95% CI 9.0–16.8%): pooled prevalence using clinician-administered DSM diagnostic interview (gold standard); meta-analysis of 14 studies; general population adults, predominantly DSM-IV criteria (Journal of Sleep Research, 2025)
- 16.3% (95% CI 11.3–23.0%): pooled prevalence when self-reported DSM criteria are used instead of clinician interview — same meta-analysis, different measurement method (Journal of Sleep Research, 2025)
- 30–40% of adults: experience insomnia symptoms (difficulty initiating or maintaining sleep) at some point — a broader symptom-level figure, not full diagnostic criteria (Circulation Research, 2026)
- 10–15%: estimated range for chronic insomnia disorder specifically, using stricter definitional criteria (Circulation Research, 2026)
- Only 31 of 237 countries had nation-specific insomnia prevalence studies included in the 2025 global modelling review — meaning most regional estimates rely on extrapolation (Sleep Medicine Reviews, 2025)
📊 What this means
No matter which measure you use, insomnia is among the most common health conditions on the planet. The difference between 12% and 16% comes down to how clinicians ask the question — not scientific confusion. If you’re reading this at 3am wondering if what you’re experiencing is “real insomnia,” the numbers suggest you’re far from alone.
Based on Sleep Medicine Reviews (2025), Journal of Sleep Research (2025), Circulation Research (2026)
Prevalence by country and region
In the Americas, an estimated 16.8% of adults have insomnia disorder — accounting for roughly 37 million people in the US, 29 million in Brazil, and 16 million in Mexico (SLEEP, 2024). In the US specifically, self-reported sleep difficulty data from 2020 shows 14.5% of adults had trouble falling asleep most or every day, and 17.8% had trouble staying asleep most or every day (CDC/NCHS, 2022).
- 16.8% (Americas overall): estimated prevalence of insomnia disorder in adults across the Americas; 2024 modelling study (SLEEP, 2024)
- ~37 million (USA): estimated adults with insomnia disorder; ~29 million (Brazil); ~16 million (Mexico) — all from 2024 modelling (SLEEP, 2024)
- 14.5% of US adults: reported trouble falling asleep most or every day — 2020 NHIS national survey data (CDC/NCHS, 2022)
- 17.8% of US adults: reported trouble staying asleep most or every day — 2020 NHIS national survey data (CDC/NCHS, 2022)
- 22.1% vs 16.9%: trouble staying asleep among US adults below 100% of the federal poverty level vs those at ≥200% FPL — a meaningful income gradient in 2020 NHIS data (CDC/NCHS, 2022)
| Country / Region | Prevalence estimate | Measure used | Source |
|---|---|---|---|
| Global (adults ≥20) | 16.2% (~852 million) | Population modelling, multiple definitions | Sleep Medicine Reviews, 2025 |
| Americas (overall) | 16.8% | Disorder-level modelling | SLEEP, 2024 |
| USA | ~37 million adults | Disorder-level modelling | SLEEP, 2024 |
| USA (symptom level) | 14.5% (falling asleep); 17.8% (staying asleep) | NHIS self-report, 2020 | CDC/NCHS, 2022 |
| Brazil | ~29 million adults | Disorder-level modelling | SLEEP, 2024 |
| Mexico | ~16 million adults | Disorder-level modelling | SLEEP, 2024 |
📊 What this means
Country-specific figures outside the Americas are sparse — the 2025 global review found nation-specific data for just 31 of 237 countries. US data from the CDC gives a useful symptom-level picture, but note that the NHIS figures measure self-reported sleep difficulty, not a clinical insomnia diagnosis; they’re not directly comparable to the disorder-level estimates in the modelling studies.
Based on SLEEP (2024), CDC/NCHS (2022), Sleep Medicine Reviews (2025)
Who is most affected? Age, sex, income, and pregnancy
Women are consistently more likely than men to have insomnia across all age groups and in every region studied. In the Americas, the gap is 19.5% (women) vs 14.0% (men) for insomnia disorder (SLEEP, 2024). Pregnancy sharply raises the risk further, with a pooled insomnia prevalence of 38.2% in pregnant women (PMC / Frontiers in Psychiatry, 2024).
- 19.5% (women) vs 14.0% (men): insomnia disorder prevalence by sex in the Americas — 2024 modelling study; total ~123 million people across both sexes (SLEEP, 2024)
- OR 1.45 (95% CI 1.32–1.58): women’s odds of insomnia symptoms vs men among US older adults (60+), controlling for age and other factors — 2025 NHIS secondary analysis, 2005–2020 data (PubMed / Frontiers, 2025)
- 38.2%: pooled insomnia prevalence in pregnant women — a systematic review and meta-analysis; pregnancy-specific drivers include physical discomfort, hormonal changes, and emotional distress (PMC / Frontiers in Psychiatry, 2024)
- 19.6% (95% CI 12.3–28.3%): DSM-defined insomnia disorder in older adults (mean age 65.9–83.1 years) — global systematic review and meta-analysis; associated with female sex, depression, anxiety, and cardiovascular/painful conditions (European Geriatric Medicine, 2023)
- 13–37.8%: range of insomnia prevalence reported for adults aged 65+ across epidemiological studies — the wide range reflects the same measurement variation seen in the general adult literature (PMC, 2026)
- 21.8% vs 13.8%: trouble staying asleep among US adults aged 45–64 vs 18–44 — 2020 NHIS data; note this is symptom-level self-report, not full insomnia disorder (CDC/NCHS, 2022)
- 22.1% vs 16.9%: trouble staying asleep among US adults below vs above the federal poverty level — 2020 NHIS; lower income is consistently associated with higher insomnia rates (CDC/NCHS, 2022)
| Group | Prevalence / Risk figure | Measure and notes | Source |
|---|---|---|---|
| Women (Americas) | 19.5% | Insomnia disorder, modelled | SLEEP, 2024 |
| Men (Americas) | 14.0% | Insomnia disorder, modelled | SLEEP, 2024 |
| Pregnant women | 38.2% | Insomnia disorder, meta-analysis; different population from general adults | PMC / Frontiers in Psychiatry, 2024 |
| Older adults (65+) | 19.6% (CI 12.3–28.3%) | DSM-defined insomnia disorder; global meta-analysis | European Geriatric Medicine, 2023 |
| US adults 45–64 (sleep maintenance) | 21.8% | Self-reported trouble staying asleep; NHIS symptom level, not diagnosis | CDC/NCHS, 2022 |
| US adults 18–44 (sleep maintenance) | 13.8% | Self-reported trouble staying asleep; NHIS symptom level | CDC/NCHS, 2022 |
| Low income (below 100% FPL, US) | 22.1% | Self-reported sleep maintenance difficulty; NHIS 2020 | CDC/NCHS, 2022 |
📊 What this means
The sex gap starts in adolescence and continues throughout life. Pregnancy roughly doubles or triples insomnia risk compared to the general adult rate — and that higher rate is driven by distinct biological and psychological factors, not the same ones as in the general population. If you’re pregnant and struggling to sleep, talk to your midwife or obstetrician: this is common and there are safe approaches to discuss.
Based on SLEEP (2024), PMC/Frontiers in Psychiatry (2024), European Geriatric Medicine (2023), CDC/NCHS (2022)
What does insomnia do to health?
Insomnia is associated with substantially higher risks of cardiovascular disease, depression, and anxiety. A 2023 meta-analysis of 21 real-world data studies found that people with insomnia had a 53% higher risk of cardiovascular mortality and a 48% higher risk of myocardial infarction compared to those without insomnia (PMC / PLOS One, 2023).
- RR 1.53 (p<0.01): relative risk of cardiovascular mortality in people with insomnia vs those without — 2023 meta-analysis, 21 real-world studies, adults (PMC / PLOS One, 2023)
- RR 1.48 (p=0.03): relative risk of myocardial infarction — same 2023 meta-analysis (PMC / PLOS One, 2023)
- RR 1.31 (p<0.01): relative risk of all-cause mortality — same 2023 meta-analysis (PMC / PLOS One, 2023)
- OR 2.60 (95% CI 1.98–3.42): odds ratio for insomnia predicting future depression — a meta-analysis of prospective cohort longitudinal studies; this describes risk over time, not a cross-sectional snapshot (BMC Psychiatry, 2016)
- OR 1.53 (95% CI 1.18–1.98): odds of developing depression or anxiety within 5 years of an insomnia diagnosis, in UK primary care patients (n=1,535 insomnia vs n=1,502 controls); data 2010–2020 (Family Practice / Oxford Academic, 2026)
- Mendelian randomisation evidence: large-scale genetic studies involving millions of participants support a likely causal link between insomnia and multiple cardiometabolic outcomes — not just an association (Circulation Research, 2026)
- Note on causality: A 2019 systematic review found that specific insomnia symptom subtypes (notably difficulty falling asleep and non-restorative sleep) were associated with mortality, but insomnia disorder overall and difficulty staying asleep were not consistently linked across studies (Sleep Medicine Reviews, 2019). The relationship is real and important, but the specific pathways are still being untangled.
📊 What this means
These associations don’t mean insomnia causes heart disease or depression in every case — the relationship is bidirectional and complex. But the scale of the associations, especially with cardiovascular outcomes, means insomnia is not just a nuisance condition. See the causes and perpetuating factors section of the guide for how these relationships work. If you’re also dealing with heart conditions, depression, or anxiety alongside sleep difficulty, that’s a reason to talk to your doctor rather than manage it alone.
Based on PMC/PLOS One (2023), BMC Psychiatry (2016), Family Practice (2026), Circulation Research (2026)
What does insomnia cost?
Chronic insomnia is associated with an average loss of 45–54 workdays of productivity per year, translating into estimated annual GDP losses of $1.8–$207.5 billion across countries (in 2019 US dollars), according to a 2023 RAND international modelling study (RAND, 2023).
- 45–54 lost workdays per year: average workplace productivity loss associated with chronic insomnia — international modelling, 2023 (RAND, 2023)
- $1.8–$207.5 billion annually: range of national GDP losses attributable to chronic insomnia across studied countries (2019 USD), equivalent to 0.64%–1.31% of GDP (RAND, 2023)
- ~14% of annual per-capita income: what people with insomnia say they would be willing to trade to avoid its consequences — a well-being valuation estimate from the same RAND study (RAND, 2023)
- Note on comparability: The RAND figures cover chronic insomnia and are modelled rather than directly measured. An older US-specific Harvard/AASM study (2011 data) estimated $63.2 billion in net annual US workplace productivity losses from insomnia — a different scope, population, and method. These two figures are not directly comparable.
📊 What this means
Most of the cost of insomnia at work comes from presenteeism — people showing up but performing below their best — not from missed days. This makes insomnia’s economic impact harder to see but no less real. The “willing to trade 14% of income” figure gives a sense of how badly people want relief.
Based on RAND (2023)
Why do insomnia estimates range from 6% to 32%+?
The wide range of insomnia prevalence figures — from around 6% to over 32% — is not a sign that the science is confused. It reflects a well-documented measurement problem: the choice of diagnostic instrument is the single biggest driver of the estimate (Frontiers in Public Health, 2026).
- 12.4%: pooled estimate using clinician-administered DSM diagnostic interview — the most rigorous method, least subject to over-reporting (Journal of Sleep Research, 2025)
- 16.3%: pooled estimate using self-reported DSM criteria questionnaires — less rigorous but more scalable for large surveys (Journal of Sleep Research, 2025)
- 32.3%: estimate produced when the Athens Insomnia Scale cut-off of ≥6 is used — a broader screening tool that captures more people with sleep difficulties that fall short of a full insomnia disorder diagnosis (Frontiers in Public Health, 2026)
- 5–10%: estimates produced when the most conservative, stricter chronic disorder criteria are applied (Sleep Medicine, 2023)
- The best range for a general adult population statement: 12.4% (clinician interview, gold standard) to 16.2% (population modelling) — these figures use the most transparent methods and are the most defensible for a lay summary.
| Method | Prevalence estimate | What it captures | Source |
|---|---|---|---|
| Clinician-administered DSM interview | 12.4% (95% CI 9.0–16.8%) | Full insomnia disorder; most rigorous | Journal of Sleep Research, 2025 |
| Self-reported DSM criteria | 16.3% (95% CI 11.3–23.0%) | Full disorder criteria; patient self-report | Journal of Sleep Research, 2025 |
| Population modelling (multiple definitions) | 16.2% (~852 million) | Combined estimate; UN population base | Sleep Medicine Reviews, 2025 |
| Athens Insomnia Scale ≥6 | 32.3% | Symptom-level screening; includes sub-threshold cases | Frontiers in Public Health, 2026 |
| Strict chronic disorder criteria | 5–10% | Most conservative; chronic insomnia disorder only | Sleep Medicine, 2023 |
📊 What this means
When you read “X% of people have insomnia,” the definition of insomnia matters enormously. Screening tools catch more people — including those with sleep difficulties that don’t fully meet diagnostic criteria. Clinical interviews catch fewer, but those they identify most reliably meet the diagnostic threshold. Neither approach is “wrong,” they answer different questions. For the full explanation of what the diagnostic criteria actually require, see the diagnosis section of the guide.
Based on Journal of Sleep Research (2025), Frontiers in Public Health (2026), Sleep Medicine Reviews (2025), Sleep Medicine (2023)
Treatment evidence in numbers
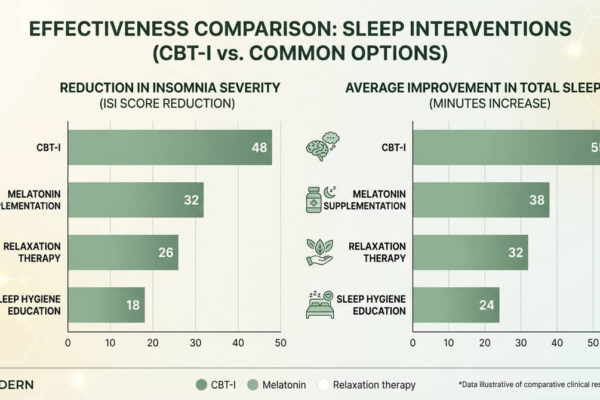
Cognitive behavioural therapy for insomnia (CBT-I) is the most evidence-rich treatment in the insomnia literature. Across all delivery settings — in-person, digital, and self-help — 52 randomised controlled trials (RCTs) show significant improvements in insomnia compared with wait-list control (PMC / Scientific Reports, 2023).
- 52 RCTs: evidence base for CBT-I across all settings (in-person, digital, self-help); all showed significant improvement vs wait-list control — network meta-analysis (PMC / Scientific Reports, 2023)
- 29 RCTs, n=9,475: evidence base for fully automated digital CBT-I specifically; showed moderate to large effects on insomnia severity vs control — 2025 systematic review and meta-analysis (npj Digital Medicine, 2025)
- Digital CBT-I and depression/anxiety: a meta-analysis of 22 RCTs found that digital CBT-I also produced small-to-moderate reductions in depressive symptoms (SMD −0.42) and anxiety symptoms (SMD −0.29) alongside its large effect on sleep (SMD −0.76) (npj Digital Medicine, 2023)
- Note on scope: These figures cover CBT-I efficacy on insomnia severity scores. They do not compare CBT-I to pharmacotherapy head-to-head, and individual response varies. Talk to a clinician about which approach suits your situation.
📊 What this means
The evidence base for CBT-I is unusually strong for a behavioural treatment — 52 RCTs is a large body of high-quality trial data. The digital version works in a comparable way, which matters because face-to-face CBT-I is often hard to access. See the CBT-I section of the main guide for what the treatment actually involves, or explore the insomnia answers page for specific questions about apps, books, and self-directed options.
Based on PMC/Scientific Reports (2023), npj Digital Medicine (2025), npj Digital Medicine (2023)
Insomnia statistics at a glance
| Topic | Figure | Who / where | Data year | Source |
|---|---|---|---|---|
| Global prevalence (modelled) | 16.2% (~852 million adults) | Adults ≥20 worldwide | 2025 | Sleep Medicine Reviews, 2025 |
| Severe insomnia (global, modelled) | 7.9% | Adults ≥20 worldwide | 2025 | Sleep Medicine Reviews, 2025 |
| Clinician-interview prevalence (global) | 12.4% (CI 9.0–16.8%) | General population adults, DSM criteria | 2025 meta-analysis | Journal of Sleep Research, 2025 |
| Insomnia symptoms (general population) | 30–40% | General adult population; symptom level | 2026 review | Circulation Research, 2026 |
| Chronic insomnia disorder (stricter criteria) | 10–15% | General adult population | 2026 review | Circulation Research, 2026 |
| Americas prevalence | 16.8% | Adults, Americas | 2024 modelling | SLEEP, 2024 |
| US adults with insomnia disorder | ~37 million | US adults | 2024 modelling | SLEEP, 2024 |
| US adults: trouble falling asleep (NHIS) | 14.5% | US adults, self-reported; symptom level | 2020 | CDC/NCHS, 2022 |
| US adults: trouble staying asleep (NHIS) | 17.8% | US adults, self-reported; symptom level | 2020 | CDC/NCHS, 2022 |
| Women vs men (Americas, disorder) | 19.5% vs 14.0% | Adults, Americas | 2024 modelling | SLEEP, 2024 |
| Women vs men OR (older adults, US) | OR 1.45 (CI 1.32–1.58) | US adults 60+ | 2005–2020 | PubMed / Frontiers, 2025 |
| Pregnant women | 38.2% | Pregnant women; meta-analysis | 2024 meta-analysis | PMC / Frontiers in Psychiatry, 2024 |
| Older adults (DSM diagnosis) | 19.6% (CI 12.3–28.3%) | Adults 65.9–83.1 mean age; global meta-analysis | 2023 meta-analysis | European Geriatric Medicine, 2023 |
| US adults 45–64: sleep maintenance | 21.8% | US adults 45–64; self-reported symptom | 2020 | CDC/NCHS, 2022 |
| Income gradient (US, sleep maintenance) | 22.1% (low income) vs 16.9% (higher income) | US adults; NHIS 2020 | 2020 | CDC/NCHS, 2022 |
| CV mortality risk (insomnia vs no insomnia) | RR 1.53 (p<0.01) | Adults; 21 real-world studies | 2023 meta-analysis | PMC / PLOS One, 2023 |
| Myocardial infarction risk | RR 1.48 (p=0.03) | Adults; 21 studies | 2023 meta-analysis | PMC / PLOS One, 2023 |
| All-cause mortality risk | RR 1.31 (p<0.01) | Adults; 21 studies | 2023 meta-analysis | PMC / PLOS One, 2023 |
| Insomnia predicting depression (OR) | OR 2.60 (CI 1.98–3.42) | Adults; prospective cohort meta-analysis | 2016 meta-analysis | BMC Psychiatry, 2016 |
| Insomnia → depression/anxiety (primary care, 5yr) | OR 1.53 (CI 1.18–1.98) | UK primary care adults; n=3,037 | 2010–2020 data | Family Practice, 2026 |
| Lost workdays (chronic insomnia) | 45–54 days/year | Working adults; international modelling | 2023 | RAND, 2023 |
| GDP loss (chronic insomnia, annual) | $1.8–$207.5 billion (0.64–1.31% GDP) | National economies; international modelling; 2019 USD | 2023 | RAND, 2023 |
| Willingness to pay to avoid insomnia | ~14% of annual income | Adults with insomnia; well-being valuation | 2023 | RAND, 2023 |
| Athens Insomnia Scale ≥6 (screening) | 32.3% | General population; symptom screening | 2026 | Frontiers in Public Health, 2026 |
| CBT-I evidence base (all settings) | 52 RCTs | Adults with insomnia disorder | 2023 meta-analysis | PMC / Scientific Reports, 2023 |
| Digital CBT-I evidence base | 29 RCTs, n=9,475 | Adults; fully automated digital CBT-I | 2025 meta-analysis | npj Digital Medicine, 2025 |
| Digital CBT-I: effect on depression | SMD −0.42 (small-to-moderate) | Adults with insomnia; 22 RCTs | 2023 meta-analysis | npj Digital Medicine, 2023 |
| Digital CBT-I: effect on sleep outcomes | SMD −0.76 (large) | Adults with insomnia; 22 RCTs | 2023 meta-analysis | npj Digital Medicine, 2023 |
| US insomnia trend 2002–2012 | 17.5% → 19.2% (+8.0% relative rise) | US adults ≥18; NHIS self-report | 2002–2012 | SLEEP Journal, 2015 |
| Countries with nation-specific prevalence data | 31 of 237 countries | Global epidemiology coverage gap | 2025 review | Sleep Medicine Reviews, 2025 |
Where the numbers disagree — and why
Disagreement 1: Global prevalence (12.4% vs 16.2% vs 32.3% vs 5–10%)
A 2025 meta-analysis using clinician-administered DSM interviews found a pooled prevalence of 12.4% (Journal of Sleep Research, 2025). A 2025 systematic review applying population modelling produced 16.2% (Sleep Medicine Reviews, 2025). A 2026 article using the Athens Insomnia Scale ≥6 found 32.3% (Frontiers in Public Health, 2026), and stricter chronic disorder criteria produce estimates of 5–10% (Sleep Medicine, 2023).
Reason (sourced): The choice of diagnostic instrument is the documented driver of this variation; a 2026 public health review states this explicitly. It is not a sign of scientific disagreement about insomnia’s reality — it is a measurement difference.
What this means for you: For a general adult population, the most defensible range is 12.4%–16.2%. Figures above 30% reflect symptom screening, not diagnosed disorder. All figures confirm insomnia is genuinely common.
Disagreement 2: Pregnant women (38.2%) vs general adult rate (12.4–16.2%)
The 38.2% figure in pregnant women (PMC / Frontiers in Psychiatry, 2024) looks dramatically different from the general adult rate. This is not a conflict — they measure different populations. The review attributes the elevated rate to pregnancy-specific physical, hormonal, and emotional factors. These are not directly comparable because populations, mechanisms, and contributing factors differ.
Disagreement 3: Mortality risk estimates vary across studies
The 2023 meta-analysis found insomnia associated with RR 1.31 for all-cause mortality (PMC / PLOS One, 2023), while a 2019 systematic review found that only specific insomnia symptom subtypes (difficulty falling asleep, non-restorative sleep) were consistently linked to mortality — not insomnia disorder overall (Sleep Medicine Reviews, 2019). The reason is partly methodological: the studies differed in how they defined insomnia, what populations they included, and how long they followed participants. This area of the evidence is still developing; causality has not been fully established, and the association likely varies by insomnia severity and presence of comorbidities.
Definitions and limits of the data
Insomnia disorder vs insomnia symptoms: Insomnia disorder requires difficulty initiating or maintaining sleep, or early morning awakening, occurring at least 3 nights per week for at least 3 months, plus significant daytime impairment (fatigue, mood disturbance, concentration difficulties, or similar). Insomnia symptoms — experienced by roughly one-third of adults — do not necessarily meet this full clinical threshold. Most of the figures on this page specify which definition was used, and you should not mix them in comparisons.
Self-report vs clinician interview: Almost all large-scale prevalence studies rely on self-reported sleep difficulty. Clinician-administered interviews consistently produce lower estimates than self-report questionnaires and screening scales, because they apply diagnostic rules more precisely and can clarify ambiguous answers.
Geographic gaps: Only 31 of 237 countries had nation-specific insomnia prevalence data in the most recent global review. Estimates for large parts of Africa, South Asia, and the Middle East rely on modelling or extrapolation.
Paediatric insomnia: All figures on this page are for adults (18+). Childhood and adolescent insomnia have different epidemiology and are not included here.
Economic burden: Economic modelling figures (GDP losses, productivity days) are estimates based on extrapolation from survey data. They carry wide ranges and should be read as orders of magnitude, not precise measurements.
Trend data: The US NHIS trend data (2002–2012) use self-reported “trouble sleeping,” not clinical insomnia disorder. A 2023 Sleep Medicine paper cites a roughly 60% increase in sleep problems since 2010, attributing this to a referenced source; the primary source for that 60% figure was not independently verified for this page, so it is not listed as a confirmed figure here.
How we compiled this page: we gathered figures from the published studies and official sources listed below, recorded each figure’s population and year, and did not run new studies or surveys. The original figures belong to their publishers; our compilation and wording may be reused with credit under CC BY 4.0. Spotted an error? Tell us.
Quick questions about insomnia statistics
How many people in the world have insomnia?
An estimated 852 million adults worldwide — about 16.2% of the global adult population — are affected by clinically relevant insomnia (Sleep Medicine Reviews, 2025). In the US alone, that figure is approximately 37 million adults (SLEEP, 2024).
These are population-level estimates based on modelling, not a direct count. The figures vary depending on the measurement method used — see the measurement problem section above for the full explanation.
Why do insomnia prevalence estimates vary so much — from 6% to 32%?
The main driver is the measurement tool used. Clinician-administered diagnostic interviews produce ~12.4%; self-reported screening questionnaires can produce 32%+ (Journal of Sleep Research, 2025; Frontiers in Public Health, 2026).
This is a well-documented methodological difference, not scientific confusion. Screening tools cast a wider net and capture people who have sleep difficulties but may not meet the full clinical definition of insomnia disorder. For a plain-language breakdown of the diagnostic criteria, see the diagnosis section of the guide.
Is insomnia becoming more common over time?
US data show a statistically significant increase: self-reported insomnia/trouble sleeping rose from 17.5% (37.5 million adults) in 2002 to 19.2% (46.2 million adults) in 2012 — an 8% relative rise (SLEEP Journal, 2015).
In older US adults (60+), sleep disturbances increased across all three measured age bands (60–69, 70–79, ≥80) from 2005 to 2020 (PubMed / Frontiers, 2025). A 2023 Sleep Medicine paper cites a ~60% increase in sleep problems since 2010, but the primary source for that figure was not independently verified for this page; treat it as an indicator of direction rather than a confirmed magnitude. Methodological consistency across time-points also limits direct comparison.
Is insomnia more common in women?
Yes, across all age groups and regions studied. In the Americas, insomnia disorder affects 19.5% of women vs 14.0% of men (SLEEP, 2024). Among US older adults, women have 1.45× the odds of insomnia symptoms compared to men (OR 1.45, 95% CI 1.32–1.58; PubMed / Frontiers, 2025).
The sex gap starts in adolescence and persists across the lifespan. Hormonal factors, higher rates of anxiety and depression, and different stress-processing patterns are among the proposed reasons — but the full picture is not yet settled. See the special populations section for more.
How effective is CBT-I — what do the numbers actually say?
CBT-I across all delivery settings is supported by 52 RCTs, all showing significant improvement vs wait-list control (PMC / Scientific Reports, 2023). Fully automated digital CBT-I specifically shows moderate to large effects in 29 RCTs (n=9,475; npj Digital Medicine, 2025).
These are group-level averages. Individual response varies, and CBT-I involves active effort — it’s not a passive treatment. For what CBT-I actually involves and whether it might suit you, the CBT-I section of the guide explains the components in plain language. If you’re wondering where to start, the insomnia starting-point tool can help you figure out your next step.
Numbers are the map — the guide is the territory
You now have the full numeric picture: who insomnia affects, how common it really is, and what the treatment evidence looks like in numbers. The next step is understanding what you can actually do about it. More context is in the Sleep Disorders hub.
Find my starting point →Sources
- Sleep Medicine Reviews — “Estimation of the global prevalence and burden of insomnia: a systematic review-based analysis” (2025) — systematic review and population modelling; used for global 16.2%, ~852 million adults, 7.9% severe insomnia, 31/237 countries figure
- Journal of Sleep Research — “The Prevalence of Insomnia Disorder in the General Population: A Meta-Analysis” (2025) — meta-analysis; used for 12.4% (clinician interview) and 16.3% (self-reported DSM) pooled prevalence
- Frontiers in Public Health — 2026 epidemiology article (2026) — review citing C1/C2; used for 32.3% (Athens Insomnia Scale ≥6) and measurement method comparison
- PMC / Frontiers in Psychiatry — “Evaluating the global prevalence of insomnia during pregnancy: a systematic review and meta-analysis” (2024) — systematic review and meta-analysis; used for 38.2% in pregnant women
- Sleep Medicine — “International study of the prevalence and factors associated with insomnia in the general population” (2021) — international study; used for sex difference in prevalence (females consistently higher)
- SLEEP Journal — “Americas Prevalence of Insomnia Disorder in Adults” (2024) — modelling study; used for Americas 16.8%, females 19.5% vs males 14.0%, US 37 million, Brazil 29 million, Mexico 16 million
- Sleep Medicine — “Insomnia symptoms in adulthood. Prevalence and incidence over 25 years” (2023) — epidemiology study; used for ~one-third of adults with symptoms, 5–10% meeting disorder criteria, 60% increase citation (flagged as unverified primary source)
- npj Digital Medicine — “Systematic review and meta-analysis on fully automated digital CBT-I” (2025) — systematic review and meta-analysis (29 RCTs, n=9,475); used for digital CBT-I moderate-to-large effects
- PMC / Scientific Reports — “Comparative efficacy of onsite, digital, and other settings for CBT-I: a systematic review and network meta-analysis” (2023) — network meta-analysis (52 RCTs); used for CBT-I evidence base across all settings
- SLEEP Journal — “Trends in insomnia and excessive daytime sleepiness among U.S. adults from 2002 to 2012” (2015) — NHIS secondary analysis; used for US trend data 17.5% (2002) → 19.2% (2012)
- PubMed / Frontiers — “Trends in Sleep Disturbances Among Older Adults: A Secondary Analysis of the NHIS” (2025) — NHIS secondary analysis (2005–2020); used for older adult trend data and OR 1.45 women vs men
- European Geriatric Medicine — “Epidemiology of insomnia disorder in older persons according to DSM: systematic review and meta-analysis” (2023) — systematic review and meta-analysis; used for 19.6% (CI 12.3–28.3%) in older adults
- PMC / PLOS One — “Incidence of adverse cardiovascular events in patients with insomnia: systematic review and meta-analysis of real-world data” (2023) — meta-analysis (21 studies); used for CV mortality RR 1.53, MI RR 1.48, all-cause mortality RR 1.31
- Sleep Medicine Reviews — “Insomnia and risk of mortality from all-cause, cardiovascular disease, and cancer: Systematic review and meta-analysis” (2019) — systematic review; used for mortality evidence complexity/caveats
- Circulation Research / AHA — “Insomnia Phenotypes, Cardiovascular Risk and Their Link to Brain Health” (2026) — review; used for 30–40% symptom prevalence, 10–15% chronic disorder, Mendelian randomisation evidence, cardiometabolic outcomes list
- RAND Corporation — “The societal and economic burden of insomnia in adults: An international study” (2023) — economic modelling study; used for 45–54 lost workdays, $1.8–$207.5 billion GDP loss, 14% income willingness-to-pay
- BMC Psychiatry — “Insomnia and the risk of depression: a meta-analysis of prospective cohort studies” (2016) — meta-analysis of prospective cohort studies; used for OR 2.60 insomnia predicting depression
- Family Practice / Oxford Academic — “Insomnia as a risk factor for the development of depression and anxiety in primary care: a matched population-based cohort study” (2026) — matched cohort study, UK; used for OR 1.53 (CI 1.18–1.98) 5-year depression/anxiety risk
- CDC/NCHS — “Sleep Difficulties in Adults: United States, 2020” (2022) — national survey data brief; used for 14.5% (falling asleep), 17.8% (staying asleep), age gradient, income gradient
- PMC — “Prevalence of insomnia and related factors in individuals aged 80 years and over: a cross-sectional study” (2026) — cross-sectional, n=419; used for 13–37.8% older adult prevalence range
- npj Digital Medicine — “Digital CBT-I on depression and anxiety: systematic review and meta-analysis” (2023) — meta-analysis (22 RCTs); used for SMD −0.42 (depression), SMD −0.29 (anxiety), SMD −0.76 (sleep)
Figures checked · 30 figures from 21 sources · Next review due March 2027