
Sleep disorders statistics: the key numbers
Sleep disorders statistics reveal big differences between self-reported symptoms and modelled disease counts. A 2025 global review found chronic insomnia in 16.2% of adults, while a 2019 modelling study estimated 936 million adults worldwide have obstructive sleep apnea. US survey data show about 1 in 6 adults struggle to fall asleep most nights.
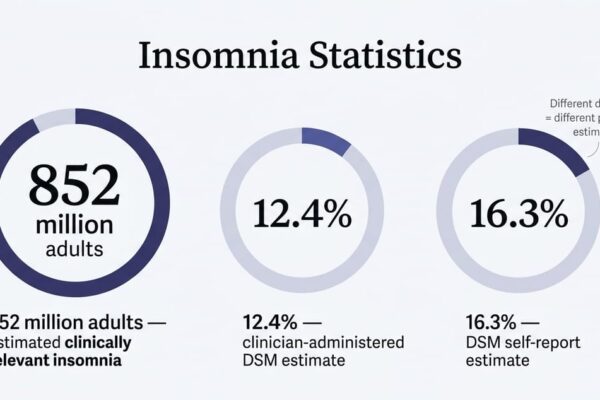
- 16.2% of adults worldwide have chronic, clinically relevant insomnia, a 2025 modelling review found (Benjafield et al., Sleep Medicine Reviews, 2025)
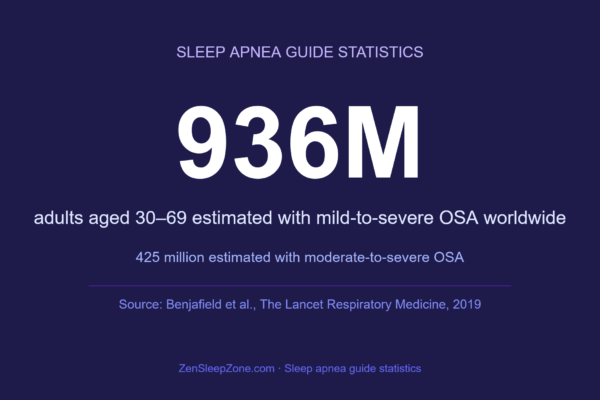
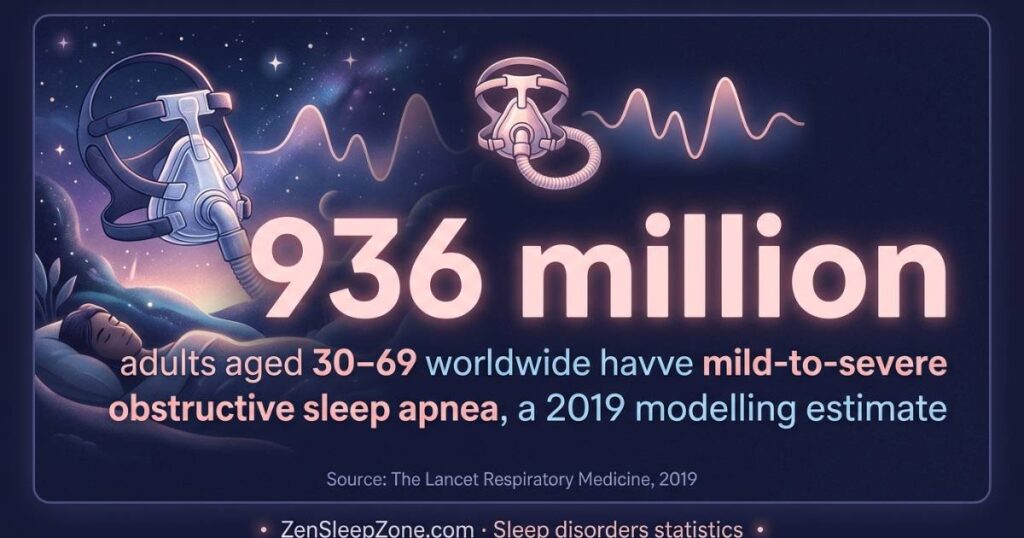
- 936 million adults aged 30–69 worldwide have mild-to-severe obstructive sleep apnea, a 2019 estimate found (Benjafield et al., The Lancet Respiratory Medicine, 2019)
- 18.1% of US adults reported trouble staying asleep most nights in 2024 (Ng et al., NCHS Data Brief 559, 2026)
- 80% of US sleep apnea cases are thought to go undiagnosed, AASM reports (AASM, National indicator report on sleep apnea, n.d.)
13 figures from 5 sources, data years 2015–2026, mostly US and global estimates. The full explanation is in our sleep disorders guide.
These figures describe groups of people, not you personally. They’re for information, not medical advice.
How common is insomnia and sleep apnea?
Insomnia and sleep apnea are common, but figures vary by definition. A 2025 global review found chronic insomnia in 16.2% of adults. US survey data put trouble falling asleep at 15.4% and trouble staying asleep at 18.1%. Sleep apnea estimates reach 936 million adults worldwide.
15.4% of US adults had trouble falling asleep most nights in the past month.
18.1% of US adults had trouble staying asleep most nights in the past month.
16.2% of adults worldwide have chronic, clinically relevant insomnia, a global modelling review estimated.
7.9% of adults worldwide have severe insomnia, the same global review estimated.
936 million adults aged 30 to 69 worldwide have mild-to-severe obstructive sleep apnea.
425 million adults aged 30 to 69 worldwide have moderate-to-severe obstructive sleep apnea.
What this means for you: These numbers describe populations, not you personally. A global modelling estimate and a US self-report survey answer different questions, so don’t expect them to match. If any of this sounds familiar, our guide to telling tiredness from a sleep disorder explains what counts as a symptom worth describing.
Who is more likely to have a sleep disorder?
Sleep disorders don’t affect everyone equally. The same 2025 global review found insomnia in 18.9% of women compared with 13.4% of men worldwide. Restless legs syndrome affects an estimated 5% to 10% of US adults. Women are affected more often, genetics research shows.
18.9% of women worldwide have chronic, clinically relevant insomnia, a global modelling review found.
13.4% of men worldwide have chronic, clinically relevant insomnia, the same review found.
5% to 10% of US adults are estimated to have restless legs syndrome.
What this means for you: Being a woman, or noticing leg discomfort at rest, doesn’t mean you have a disorder. These are group patterns, not a personal forecast. Our answers page explains what an urge to move your legs is, and isn’t, a sign of.
How many sleep apnea cases go undiagnosed?
Most sleep apnea goes unrecognized. The American Academy of Sleep Medicine estimates obstructive sleep apnea affects nearly 30 million Americans. About 80% of those cases are thought to go undiagnosed, the AASM reports. A single negative home breathing test does not always rule it out.
Nearly 30 million Americans are estimated to have obstructive sleep apnea.
80% of US sleep apnea cases are estimated to go undiagnosed.
What this means for you: A missed diagnosis is common, not a personal failing. If a home test comes back negative but symptoms continue, a lab study can look more closely. Our guide to sleep tests explains what each one actually measures.
How many adults get too little sleep or wake unrested?
Short sleep and poor rest are common, separate from a diagnosed disorder. A 2024 US national survey found 30.5% of adults slept less than seven hours a night. Only 54.8% said they woke feeling well-rested most days, leaving many adults in between.
30.5% of US adults slept less than seven hours in a typical 24 hours.
54.8% of US adults said they woke feeling well-rested most days or every day.
What this means for you: Not every tired morning means a disorder. Limited sleep opportunity, not a condition, explains much of this gap. Tracking your own nights for a week or two, using our sleep appointment planner, can show whether a pattern is worth describing to a clinician.
Can these numbers tell you if you have a sleep disorder?
No single statistic can diagnose you. US symptom surveys and global disease models measure different things, using different definitions and populations. A high population percentage only shows how common a pattern is among many people, not what is happening in your body.
What this means for you: These figures describe large groups, not your own sleep. If a pattern worries you, matching it to a likely explanation and a next step matters more than any single percentage. Start with our sleep disorders compass to choose where to go next.
Sleep disorders statistics table
| What it measures | Figure | Who / based on | Compared with · when | Source |
|---|---|---|---|---|
| Trouble falling asleep most nights | 15.4% (observed) | US adults · 2024 national survey | no comparator · 2024 | Ng et al., NCHS Data Brief 559, 2026 |
| Trouble staying asleep most nights | 18.1% (observed) | US adults · 2024 national survey | no comparator · 2024 | Ng et al., NCHS Data Brief 559, 2026 |
| Sleep duration under 7 hours | 30.5% (observed) | US adults · 2024 national survey | no comparator · 2024 | Ng et al., NCHS Data Brief 559, 2026 |
| Waking well-rested most days | 54.8% (observed) | US adults · 2024 national survey | no comparator · 2024 | Ng et al., NCHS Data Brief 559, 2026 |
| Mild-to-severe obstructive sleep apnea, global | 936 million (estimated/modelled) | adults 30–69 · 17 studies, 16 countries | none · published 2019 | Benjafield et al., The Lancet Respiratory Medicine, 2019 |
| Moderate-to-severe obstructive sleep apnea, global | 425 million (estimated/modelled, subset of row above) | adults 30–69 · global | none · published 2019 | Benjafield et al., The Lancet Respiratory Medicine, 2019 |
| Chronic clinically relevant insomnia, global | 16.2% / ~852 million (estimated/modelled) | adults worldwide | none · published 2025 | Benjafield et al., Sleep Medicine Reviews, 2025 |
| Severe insomnia, global | 7.9% / ~415 million (estimated/modelled) | adults worldwide | none · published 2025 | Benjafield et al., Sleep Medicine Reviews, 2025 |
| Chronic insomnia in women, global | 18.9% (estimated/modelled) | women worldwide | compared with men below · published 2025 | Benjafield et al., Sleep Medicine Reviews, 2025 |
| Chronic insomnia in men, global | 13.4% (estimated/modelled) | men worldwide | compared with women above · published 2025 | Benjafield et al., Sleep Medicine Reviews, 2025 |
| Restless legs syndrome | 5%–10% (estimated) | US adults | none · no date given | National Library of Medicine, MedlinePlus Genetics, n.d. |
| Obstructive sleep apnea, US | nearly 30 million people (estimated) | US adults | none · no date given | AASM, National indicator report on sleep apnea, n.d. |
| Undiagnosed share of US sleep apnea | 80% (estimated) | US adults with OSA | none · no date given | AASM, National indicator report on sleep apnea, n.d. |
Why the numbers differ
Global and US figures answer different questions. The global insomnia review modelled 16.2% of adults using strict, clinically relevant criteria across many countries (Benjafield et al., Sleep Medicine Reviews, 2025). The US survey instead asked about trouble falling or staying asleep in the past month, giving 15.4% and 18.1% (Ng et al., NCHS Data Brief 559, 2026). Neither figure is wrong. They measure different things, in different places, with different questions.
The same gap shows up in sleep apnea. The 936 million worldwide figure comes from a model built on studies in 16 countries, using breathing-event counts (Benjafield et al., The Lancet Respiratory Medicine, 2019). The AASM’s estimate of nearly 30 million Americans reflects US-specific surveillance, not the same modelling method. These two numbers should not be added together or compared directly (AASM, National indicator report on sleep apnea, n.d.).
What the numbers can’t tell you
These figures describe groups, not individuals. A population percentage cannot diagnose you, and survey questions vary by country and year. Narcolepsy, central sleep apnea, and most parasomnias don’t have a reliable, consistently measured prevalence figure for this page. Ask a clinician about these directly. Self-reported symptoms also differ from a breathing test or a clinical interview, and people without a bed partner may underreport problems like snoring or breathing pauses.
How we compiled this page: we gathered figures from the published studies and official sources below, recorded each figure’s outcome, population, comparison, timepoint and year exactly as published, and ran no surveys of our own. The original figures belong to their publishers; our compilation and wording may be reused with credit under CC BY 4.0.
Ready to turn these numbers into your next step?
See how symptoms, tests and care connect in our mind map, or start at our compass if ready to act. More in our sleep disorders hub.
See how it all connects →Sources
- Ng et al., NCHS Data Brief 559 (2026) — official statistical report; used for: trouble falling asleep, trouble staying asleep, short sleep duration, waking rested.
- Benjafield et al., The Lancet Respiratory Medicine (2019) — population modelling study; used for: global obstructive sleep apnea prevalence, mild-to-severe and moderate-to-severe estimates.
- Benjafield et al., Sleep Medicine Reviews (2025) — systematic review and modelling study; used for: global insomnia prevalence, severe insomnia, prevalence by sex.
- National Library of Medicine, MedlinePlus Genetics — reviewed genetics overview; used for: restless legs syndrome prevalence in US adults.
- American Academy of Sleep Medicine, National indicator report on sleep apnea — official organization report; used for: US obstructive sleep apnea prevalence and undiagnosed share.
Figures checked · 13 figures from 5 sources · Next review
How we made this page: figures gathered and checked from the sources above, written up with AI assistance and edited by Aamir Bashir, Founder & Editor. Read our editorial policy.