
Sleep and mental health statistics: the key numbers
Sleep and mental health statistics show two patterns. National survey data say about 3 in 10 US adults sleep less than 7 hours a night, and roughly 1 in 6 to 1 in 5 have frequent trouble falling or staying asleep. Separately, long-term studies link insomnia with far higher odds of later depression and anxiety, and treatment trials show sleep improvement can ease mood symptoms too.
- 30.5% of US adults slept less than 7 hours a night in 2024 (Ng et al., NCHS Data Brief 559, 2026)
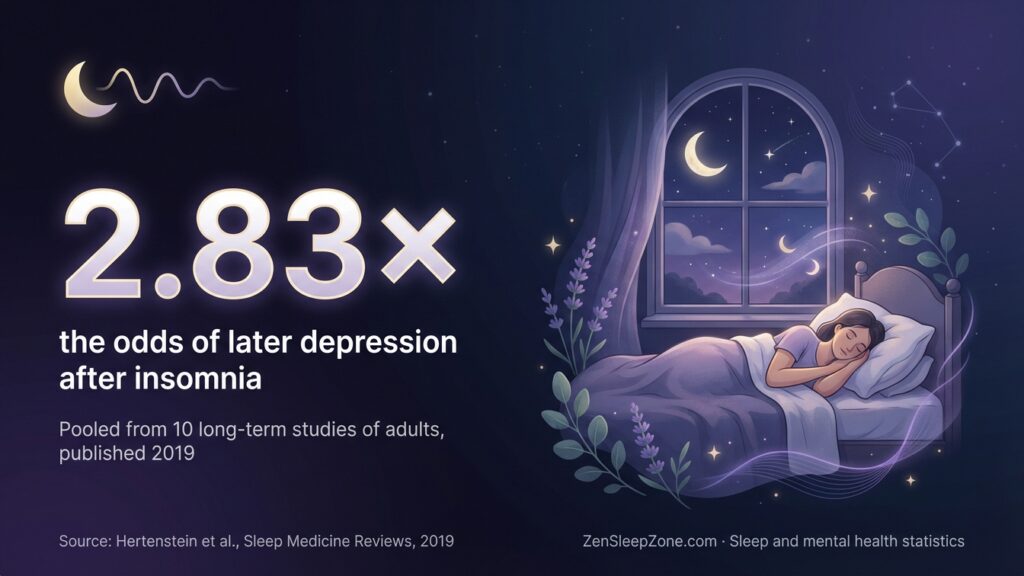
- 2.83 times the odds of later depression followed insomnia across 10 long-term studies (Hertenstein et al., Sleep Medicine Reviews, 2019)
- -0.63 standardized difference in depression symptoms when trials improved sleep (Scott et al., Sleep Medicine Reviews, 2021)
13 figures from 7 sources, data years 2012–2026, mostly US and UK. The full explanation is in our sleep and mental health guide.
These figures describe groups of people, not you personally. They’re for information, not medical advice.
How common are sleep problems among US adults?
About 3 in 10 US adults got less than 7 hours of sleep in 2024. Roughly 1 in 6 to 1 in 5 had frequent trouble falling or staying asleep, a national health survey found. These are separate measures, and they can overlap in the same person.
30.5% of US adults slept less than 7 hours a night in 2024, about 3 in 10.
15.4% of US adults had trouble falling asleep most days or every day in the past month.
18.1% of US adults had trouble staying asleep most days or every day in the past month.
What this means for you: These numbers describe large groups, not any one person’s sleep. If this sounds like your pattern, our quick router can point you to the right next step.
How much does insomnia raise the odds of depression and anxiety?
A 2019 review pooled long-term studies and found insomnia came before higher odds of depression and anxiety. These are study-level odds, not a personal forecast. They show a pattern worth asking a clinician about.
2.83 times the odds of later depression followed insomnia in adults tracked over time.
3.2 times the odds of later anxiety followed insomnia in adults tracked over time.
What this means for you: Higher odds describe groups of study participants, not your own risk. If you have one specific question about depression, anxiety or a treatment combination, our answers page covers it in plain terms.
Can improving sleep help depression, anxiety and stress symptoms?
A 2021 review pooled 65 randomized trials that improved sleep. On average, depression, anxiety and stress symptoms also improved. Each outcome drew on a different number of trials and people, so the three figures are not directly comparable.
-0.63 standardized difference in depression symptoms when trials successfully improved sleep.
-0.51 standardized difference in anxiety symptoms when trials successfully improved sleep.
-0.42 standardized difference in stress symptoms when trials successfully improved sleep.
What this means for you: These are averages across many trials, not a cure rate for any one person. See how this translates into real treatment choices in which treatment options are worth discussing.
Have sleep problems become more common over time?
English national surveys tracked insomnia from 1993 to 2007. Both reported symptoms and diagnosed insomnia rose over that period, though self-reported symptoms stayed far more common than formal diagnosis throughout.
35.0% to 38.6% of English adults reported insomnia symptoms, rising from 1993 to 2007.
3.1% to 5.8% of English adults had a diagnosed insomnia, rising from 1993 to 2007.
What this means for you: More reported symptoms than diagnoses suggests many people never discuss sleep with a clinician. Read the two-way explanation of how sleep and mental health affect each other.
What do guidelines say about typical treatment and prep timelines?
These next figures are guidance ranges from official patient education, not research outcomes. They describe how long a course or a preparation step commonly takes, not a promise of symptom-free sleep by a set date.
6 to 8 weeks is the treatment-plan length commonly described for CBT-I.
1 to 2 weeks is the suggested length for a sleep diary before a doctor’s visit.
7 to 9 hours is the average nightly sleep need described for adults.
What this means for you: A diary or a treatment course is a starting point, not a deadline. Build your own notes with the sleep-and-mood visit planner.
Sleep and mental health statistics table
| What it measures | Figure | Who / based on | Compared with · when | Source |
|---|---|---|---|---|
| Short average sleep | 30.5% | US adults · 2024 NHIS | national average · 2024 | Ng et al., NCHS Data Brief 559, 2026 |
| Trouble falling asleep | 15.4% | US adults · 2024 NHIS | past 30 days · 2024 | Ng et al., NCHS Data Brief 559, 2026 |
| Trouble staying asleep | 18.1% | US adults · 2024 NHIS | past 30 days · 2024 | Ng et al., NCHS Data Brief 559, 2026 |
| Insomnia and later depression | OR 2.83 (95% CI 1.55–5.17) | Adults · 10 longitudinal studies | vs no insomnia at baseline · published 2019 | Hertenstein et al., Sleep Medicine Reviews, 2019 |
| Insomnia and later anxiety | OR 3.2 | Adults · 6 longitudinal studies | vs no insomnia at baseline · published 2019 | Hertenstein et al., Sleep Medicine Reviews, 2019 |
| Sleep improvement and depression | SMD -0.63 (95% CI -0.84 to -0.43) | 61 comparisons, 7,868 adults | vs control groups · studies to Feb 2021 | Scott et al., Sleep Medicine Reviews, 2021 |
| Sleep improvement and anxiety | SMD -0.51 | 35 comparisons, 5,819 adults | vs control groups · studies to Feb 2021 | Scott et al., Sleep Medicine Reviews, 2021 |
| Sleep improvement and stress | SMD -0.42 | 6 comparisons, 419 adults | vs control groups · studies to Feb 2021 | Scott et al., Sleep Medicine Reviews, 2021 |
| Insomnia symptoms, England | 35.0% → 38.6% | Adults, private households, England | 1993 vs 2007 surveys | Calem et al., Sleep, 2012 |
| Insomnia diagnosis, England | 3.1% → 5.8% | Adults, private households, England | 1993 vs 2007 surveys | Calem et al., Sleep, 2012 |
| CBT-I course length | 6–8 weeks | Guidance, not a study outcome | course duration | NHLBI, Insomnia Treatment, 2022 |
| Sleep diary before a visit | 1–2 weeks | Guidance, not a study outcome | before seeing a doctor | NHLBI, Insomnia Diagnosis, 2022 |
| Average adult sleep need | 7–9 hours | Guidance, not a study outcome | nightly | NHS, Insomnia, 2024 |
Why the numbers differ
The NCHS figures (30.5%, 15.4%, 18.1%) come from one US survey asking about recent symptoms. The Hertenstein odds ratios come from pooled long-term studies asking whether insomnia came before a later diagnosis. These answer different questions: how common now, versus what insomnia predicts later. The Scott figures use a standardized difference (SMD), a research way of comparing groups, not a percentage improved — it cannot be turned into “X% got better.” The Calem trend numbers are from England only, two decades old, and cannot be compared with the newer US snapshot figures above.
What the numbers can’t tell you
The NCHS brief does not publish the exact number of people behind each percentage for sleep-specific outcomes, so we show the published rate without inventing a sample size. Self-reported sleep problems are not the same as a clinical insomnia diagnosis, and most people with symptoms never get a formal diagnosis, based on the England trend data above. The Scott review’s follow-up times varied by trial, so a single timepoint cannot be given for “how long the improvement lasts.”
We found no reliable, dated figure this run for how many people with sleep and mood symptoms actually get professional care, or for CBT-I’s dropout rate specifically — that gap stays open rather than being filled with a rough guess. All figures describe groups of study participants or survey respondents, not individual predictions.
How we compiled this page: we gathered figures from the published studies and official sources below, recorded each figure’s outcome, population, comparison, timepoint and year exactly as published, and ran no surveys of our own. The original figures belong to their publishers; our compilation and wording may be reused with credit under CC BY 4.0.
Turn these numbers into your own next step
See how sleep, mood and daytime difficulties connect in the mind map. More in our mental health pillar.
See how it all connects →Sources
- Ng et al. — Short Sleep Duration and Sleep Difficulties Among Adults: United States, 2024 (NCHS Data Brief 559) (2026) — official population survey report; used for: short sleep, trouble falling asleep, trouble staying asleep
- Hertenstein et al. — Insomnia as a predictor of mental disorders (2019) — systematic review and meta-analysis; used for: insomnia and later depression odds, insomnia and later anxiety odds
- Scott et al. — Improving sleep quality leads to better mental health (2021) — systematic review and meta-analysis of randomized trials; used for: sleep improvement and depression, anxiety and stress symptoms
- Calem et al. — Increased Prevalence of Insomnia and Changes in Hypnotics Use in England over 15 Years (2012) — national survey analysis; used for: insomnia symptom and diagnosis trends in England
- NHLBI — Insomnia Treatment (2022) — official patient education; used for: CBT-I course length guidance
- NHLBI — Insomnia Diagnosis (2022) — official patient education; used for: sleep diary preparation guidance
- NHS — Insomnia (2024) — health-service patient guidance; used for: average adult sleep need guidance
Figures checked · 13 figures from 7 sources · Next review
How we made this page: figures gathered and checked from the sources above, written up with AI assistance and edited by Aamir Bashir, Founder & Editor. Read our editorial policy.